
Americans are increasingly reaching for snacks with the snacking category clocking up $33bn in retail sales, according to the market research firm.
Nielsen’s “The Sweet Success of Snacking across the Store” Report – published in October 2017 – found annual household spend on individually packaged snacks has risen by 1.1% compared to the year prior.
Snacking categories
Nielsen’s report analyzed dollar growth between 2013 and 2016, examining snacks across all categories:
- Jerky
- Dairy (individually-wrapped cheese, yogurt cups, ice cream cones/cups)
- Confection (single serve candy)
- Salty Snacks (salty snacks under 3.5 oz, snack mixes under 5 oz)
- Fresh-cut fruits and vegetables (upc + Non-upc) under 10 oz; single serve refrigerated fruit smoothies and fruit jars/cups
- Bars (all health, meal replacement, performance, weight management, cereal/granola bars)
- Cookies/Crackers (under 4 oz)
- Nuts/Seeds (under 5 oz)
- Sweet Snacks (under two servings)
- All other (Fruit snacks, snack combos with meat or cheese, snack combos with dip
Health prevails…
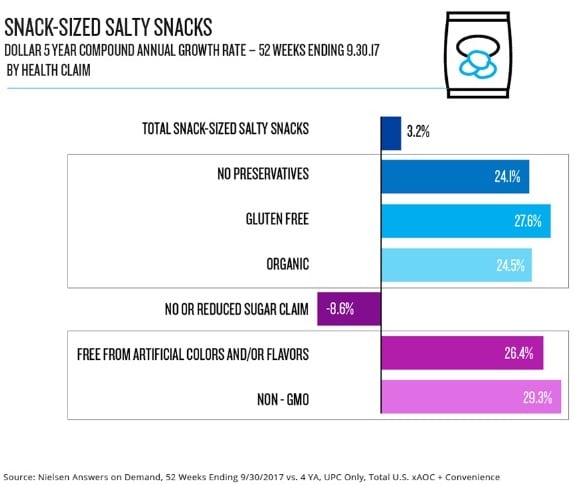
For the five-year period, ending 30 September 2017, snacks touting better-for-you claims saw the strongest CAGR growth.
Even in the traditionally indulgent snacking categories like Salty Snacks, free-from are driving sales.
Snacks with non-GMO claims saw an 18.2% boost in sales for each of the past five years; followed by products free from artificial colors and flavors (16.2%); and no or reduced sugar claims (11.3%).
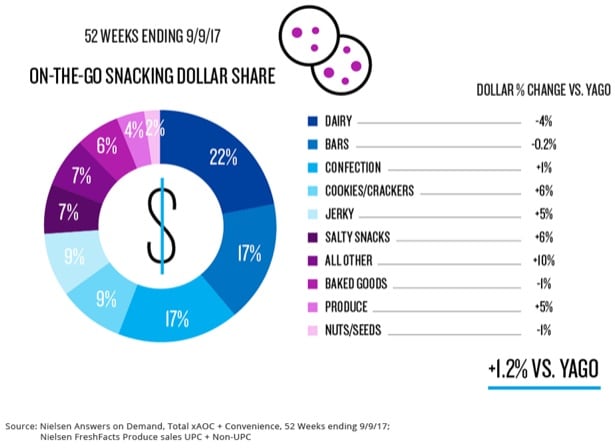
Comparatively, the average snack product saw an increase of only 1.2%.
In terms of percentages, dairy snacks accounted for 22% of the snacking dollars; however, categories including Salty Snacks (+6%), Cookies/Crackers (+6%), Jerky (+5%) and Produce (+5%) lead growth across the individual snacking market.
…but convenience is still king
Although consumers are striving to make healthier life choices, quick and convenient snacking still dominates.
During the last minute quick trip to a convenience store, US consumers tend to opt less for healthy options, possibly because there are fewer healthy options sold in a convenience store compared to a conventional supermarket.
Opportunities abound
However, said Nielsen, with 44.2% of consumers willing to pay premium prices at convenience stores, this channel is wide open to introduce healthier snacking options.
Additionally, research showed that 33% of convenience store shoppers plan to purchase fresh food at convenience stores in the future, opening up the opportunity for further innovation in this category.
Snack attack
- 98% of US householdshas purchased a snack at least once for quick consumption.
- US households spend $133 annually on snacks
- Consumers, on average, purchase snacks twice a month (22.3 times per year).
- Large families – with five or more members – purchase 16% more individually packed snacks than the average family.
As the individual snacking category expands its dollar share, the time is ripe for retailers and manufacturers to take innovation by the horns to meet consumer needs, said Nielsen.
Expanding individual snacking options across all categories – especially focussing on healthy and convenient options – will keep consumers coming back for more.
Beef, chicken …, or snack?
Evident of the US consumer’s predilection to eat a snack in place of a meal, the Bar category lead the pack with an increase of $633m in sales.
To capitalize on this trend, US retailers and manufacturers are increasingly offering single-serve grab-and-go products.
The Jerky category came second in highest dollar sales, with a $547m spending jump, while Cookies and Crackers brought in $469m more.